Insights
Learn about Insights and the different visual and analytic tools available in the Finix Dashboard.
The Finix Dashboard has several charts and visual tools available to help provide an at-a-glance overview of key performance metrics for platforms and sellers.
- Use the date and column filters to breakdown your payment data.
- The data visualized updates as you change the filtered dates and columns.
Home
The Home page is the first page you see when you log in to the Finix Dashboard and open your sandbox.
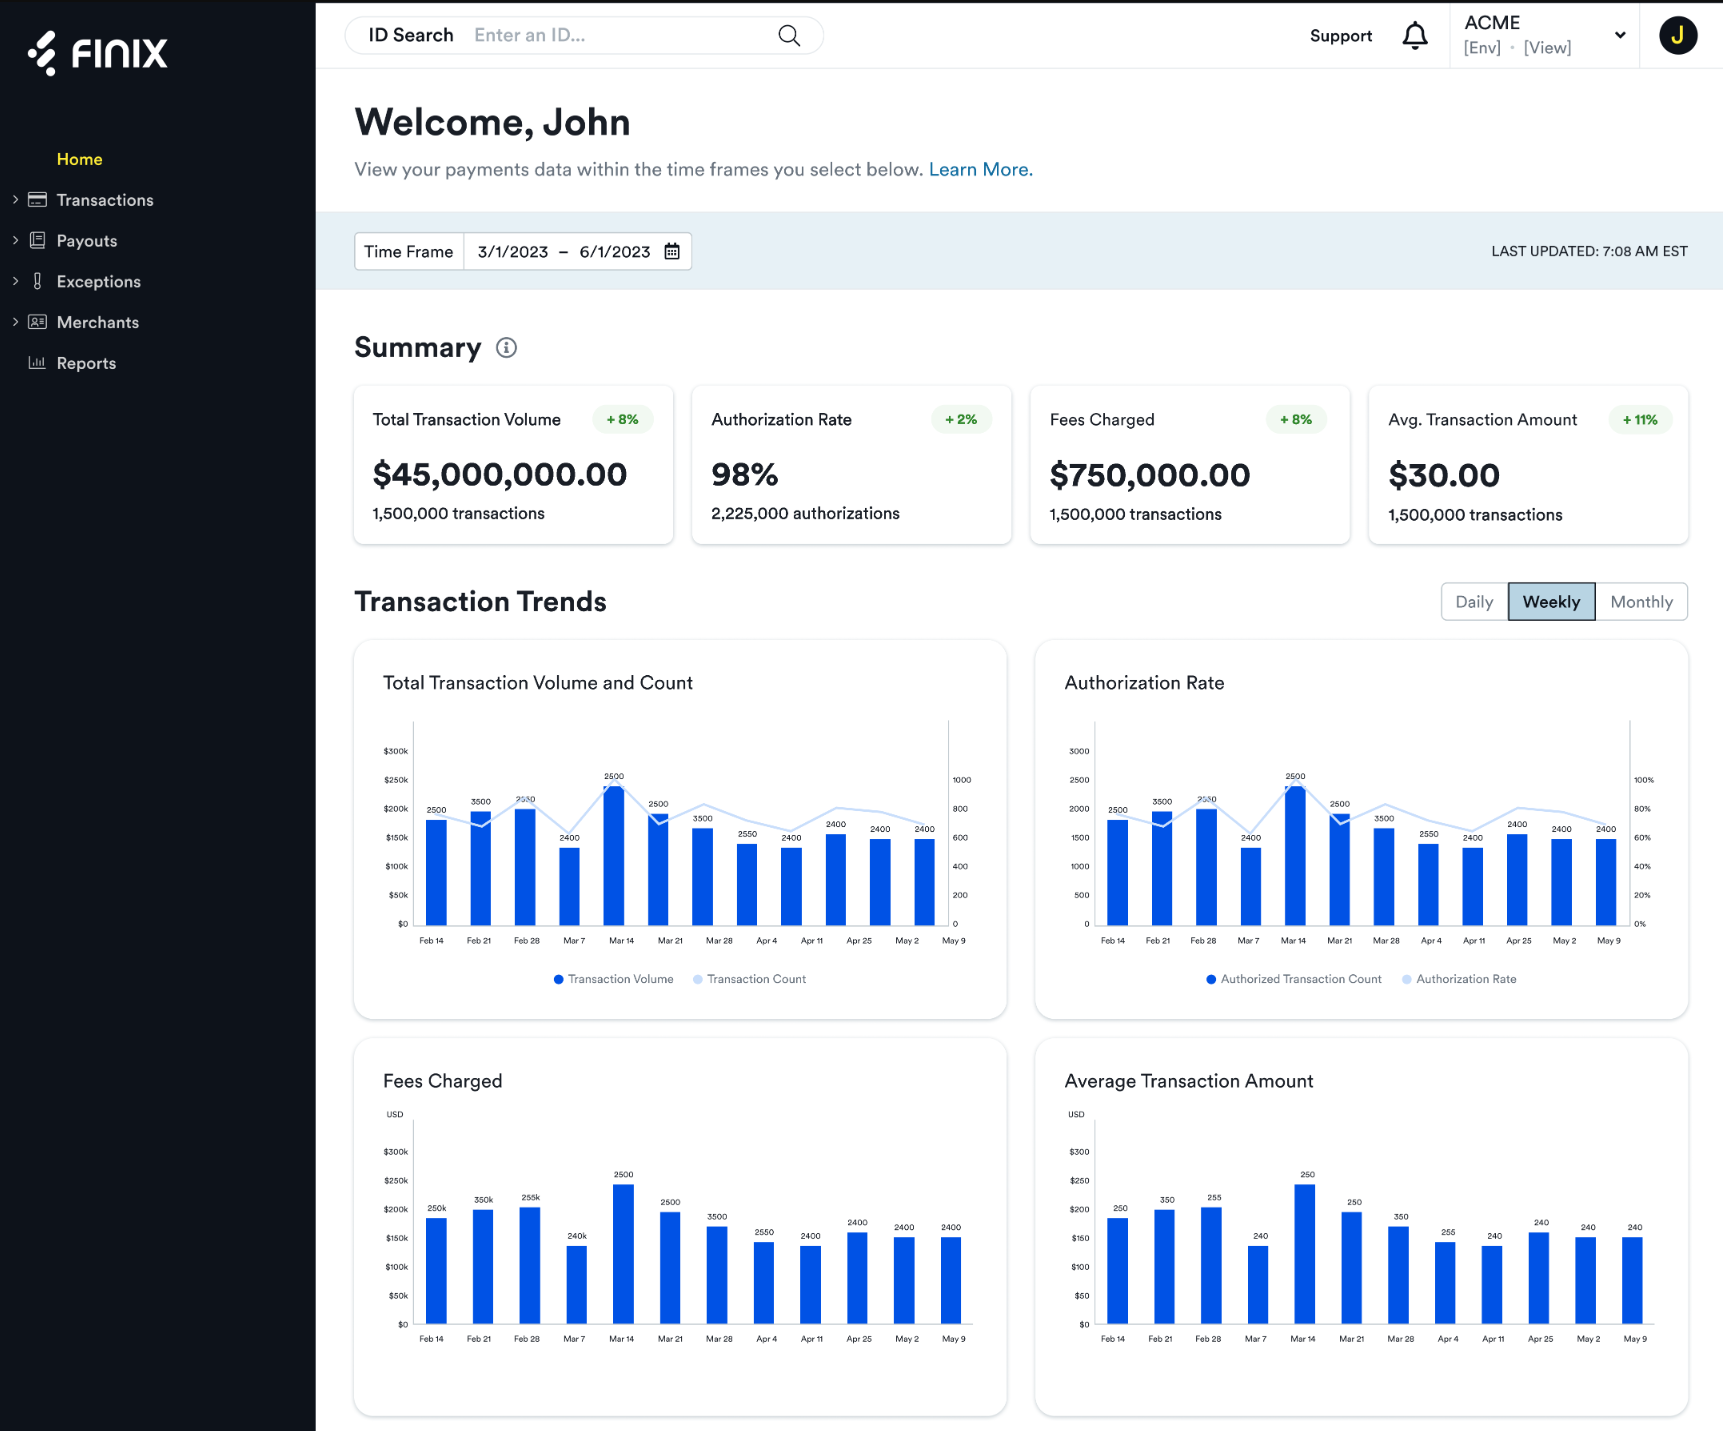
Analytics available on the Home page includes the following:
Summary
A snapshot of the payments processed.
| Analytic | Description |
|---|---|
| Total Transaction Volume | The total aggregate of all transactions, both Transfers and Authorizations. |
| Authorization Rate | Percentage of Transfers and Authorizations attempted that were successfully processed (doesn't include refunds). |
| Merchant Fees Collected | The total aggregate of all processing fees. |
| Avg. Transaction Amount | The average amount of transactions (both Transfers and Authorizations) processed across all Merchants. |
Transaction Trends
Detailed breakdown the data provided in the Summary by Day, Month, or Year.
| Analytic | Description |
|---|---|
| Total Transaction Volume and Count | The total aggregate and count of all transactions, both Transfers and Authorizations. |
| Authorization Rate | Percentage of Transfers and Authorizations attempted that were successfully processed compared to the number attempted (doesn't include refunds). |
| Merchant Fees Collected | The total aggregate of all processing fees. |
| Average Transaction Amount | The average amount of transactions (both Transfers and Authorizations) processed across all Merchants. |
Last Month's Insights
A breakdown of the payment data processed from the prior calendar month.
| Analytic | Description |
|---|---|
| Total Residual Amount | Total returned to the platform. |
| Avg. Interchange % | Average interchange charged per transaction. |
| Avg. Dues and Assessments % | Average amount of transactions that get paid as fees. |
| Card Payments | Total count of card payments processed. |
Year-to-Date Insights
Payment data for the current calendar year.
| Analytic | Description |
|---|---|
| Active Merchants | Number of unique Merchants that are actively processing transactions. |
| Disputes | Number of Disputes filed by buyers against Merchants. |
| ACH Returns | Number of ACH transactions returned due to processing issues. |
| Chargeback Rate | Total percentage of Disputes submitted compared to the number transactions processed. |
Transactions
The Transactions Insights page is available to help you dig deeper into the metrics of how your business processes payments.
To open the Transactions Insights page, click Transactions > Transaction Insights.
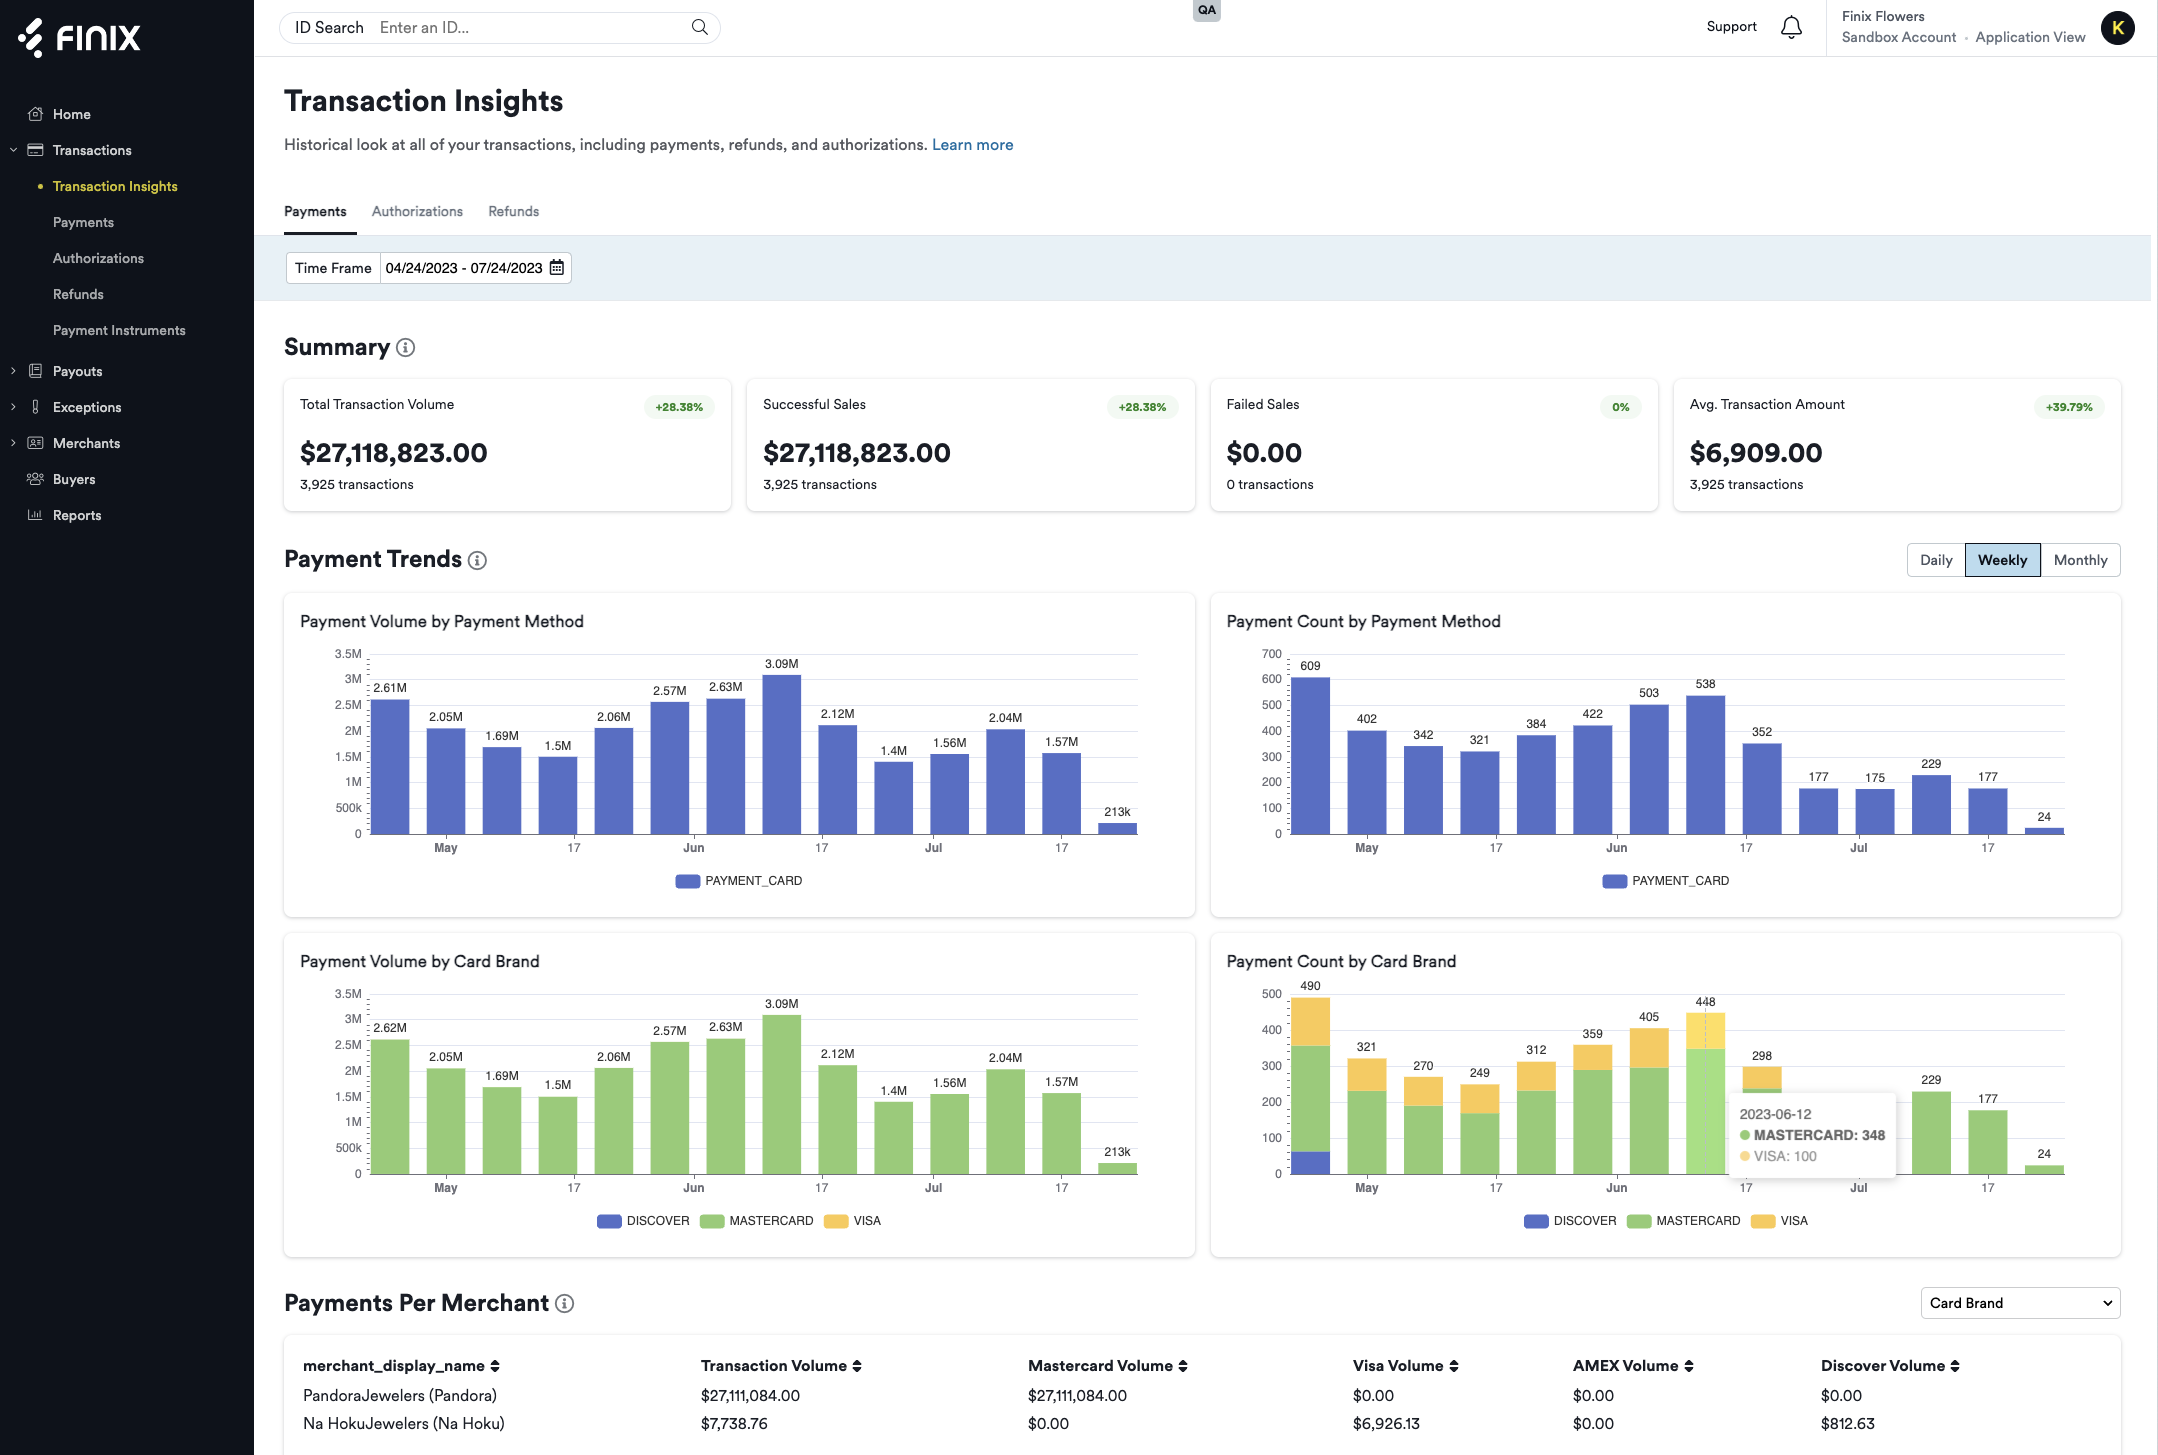
Analytics available on the Transaction Insights page includes the following:
Payments
A breakdown of the payments and transactions processed (both Transfers and Authorizations).
Summary
A snapshot of the payments processed.
| Analytic | Description |
|---|---|
| Total Transaction Vol. | The total aggregate of all transactions, both Transfers and Authorizations, for all of your Merchants. |
| Successful Sales | The total aggregate of all Transfers for all of your Merchants. |
| Failed Sales | The total aggregate of failed Transfers for all of your Merchants. |
| Avg. Transaction Amount | The average amount of transactions (both Transfers and Authorizations) processed across all Merchants. |
Payment Trends
Break down payment method and card brand data by Day, Month, or Year.
| Analytic | Description |
|---|---|
| Payment Volume by Payment Method | Break down transaction volume by the different payment methods used by buyers. |
| Payment Count by Payment Method | Break down the number of transactions processed by the different payment methods used by buyers. |
| Payment Volume by Card Brand | Filter transaction volume by the different card brands used by buyers. |
| Payment Count by Card Brand | Filter the number of transactions processed by the different card brands used by buyers. |
Payments Per Merchant
Transaction data broken down across all Merchants.
Available for platforms only, for more details, see Platform Payments.
Card Payment Data
Filter the payment data you've processed by:
- Card Brand
- Card Type
- Card Issuer Country
- Payment Channel
Failed Transactions by Failure Code
A detailed breakdown of failed transactions by the failure code that was returned.
Authorizations
A breakdown of the Authorizations processed.
Summary
A snapshot of the Authorizations processed.
| Analytic | Description |
|---|---|
| Requests Received | The total aggregate of all transactions, both Transfers and Authorizations. |
| Authorization Rate | Total percentage of successful Authorizations compared to the number attempted (doesn't include refunds). |
| Voided Authorizations | The total aggregate of voided Authorizations. |
| Captured Authorizations | The total aggregate of successfully captured Authorizations. |
Authorization Trends
Break down approved Authorizations and card brand data by Day, Month, or Year.
| Analytic | Description |
|---|---|
| Authorization Rate by Card Brand | Total percentage of successful Authorizations broken down by the card brand used by buyers. |
| Authorization Count by Card Brand | Total count of successful Authorizations broken down by the card brand used by buyers. |
Authorizations Per Merchant
Authorization data broken down across all Merchants.
Available for platforms only, for more details, see Platform Payments.
Card Authorization Data
Authorization data broken down across all Merchants.
Available for platforms only, for more details, see Platform Payments.
Failed Authorizations by Failure Code
A detailed breakdown of failed Authorizations by the failure code that was returned.
Refunds
A breakdown of the refunds processed.
Summary
A snapshot of the refunds processed.
| Analytic | Description |
|---|---|
| Gross Processing Vol. | The total aggregate of all transactions, both Transfers and Authorizations minus the total aggregate of refunds processed. |
| Successful Refunds | The total aggregate of successfully processed refunds. |
| Failed Refunds | The total aggregate of failed refunds. |
| Total Transaciton Vol. | The total aggregate of all transaction volume. |
Refund Trends
Break down refund, payment method, and card brand data by Day, Month, or Year.
| Analytic | Description |
|---|---|
| Refund Volume by Payment Method | Total aggregate of successful refunds broken down by the payment method used by buyers. |
| Refund Count by Payment Method | Total count of refunds broken down by the payment method used by buyers. |
| Refund Volume by Card Brand | Total aggregate of successful refunds broken down by the card brand used by buyers. |
| Refund Count by Card Brand | Total count of refunds broken down by the card brand used by buyers. |
Refunds Per Merchant
Data surrounding the refunds processed broken down across all Merchants.
Available for platforms only, for more details, see Platform Payments.
Card Refund Data
Data surrounding refunded card transactions broken down by the card brands used by buyers.
Exceptions
Use the Exceptions Insights page to review metrics about returned or disputed transactions.
To open the Exceptions Insights page, click Exceptions > Exceptions Insights.
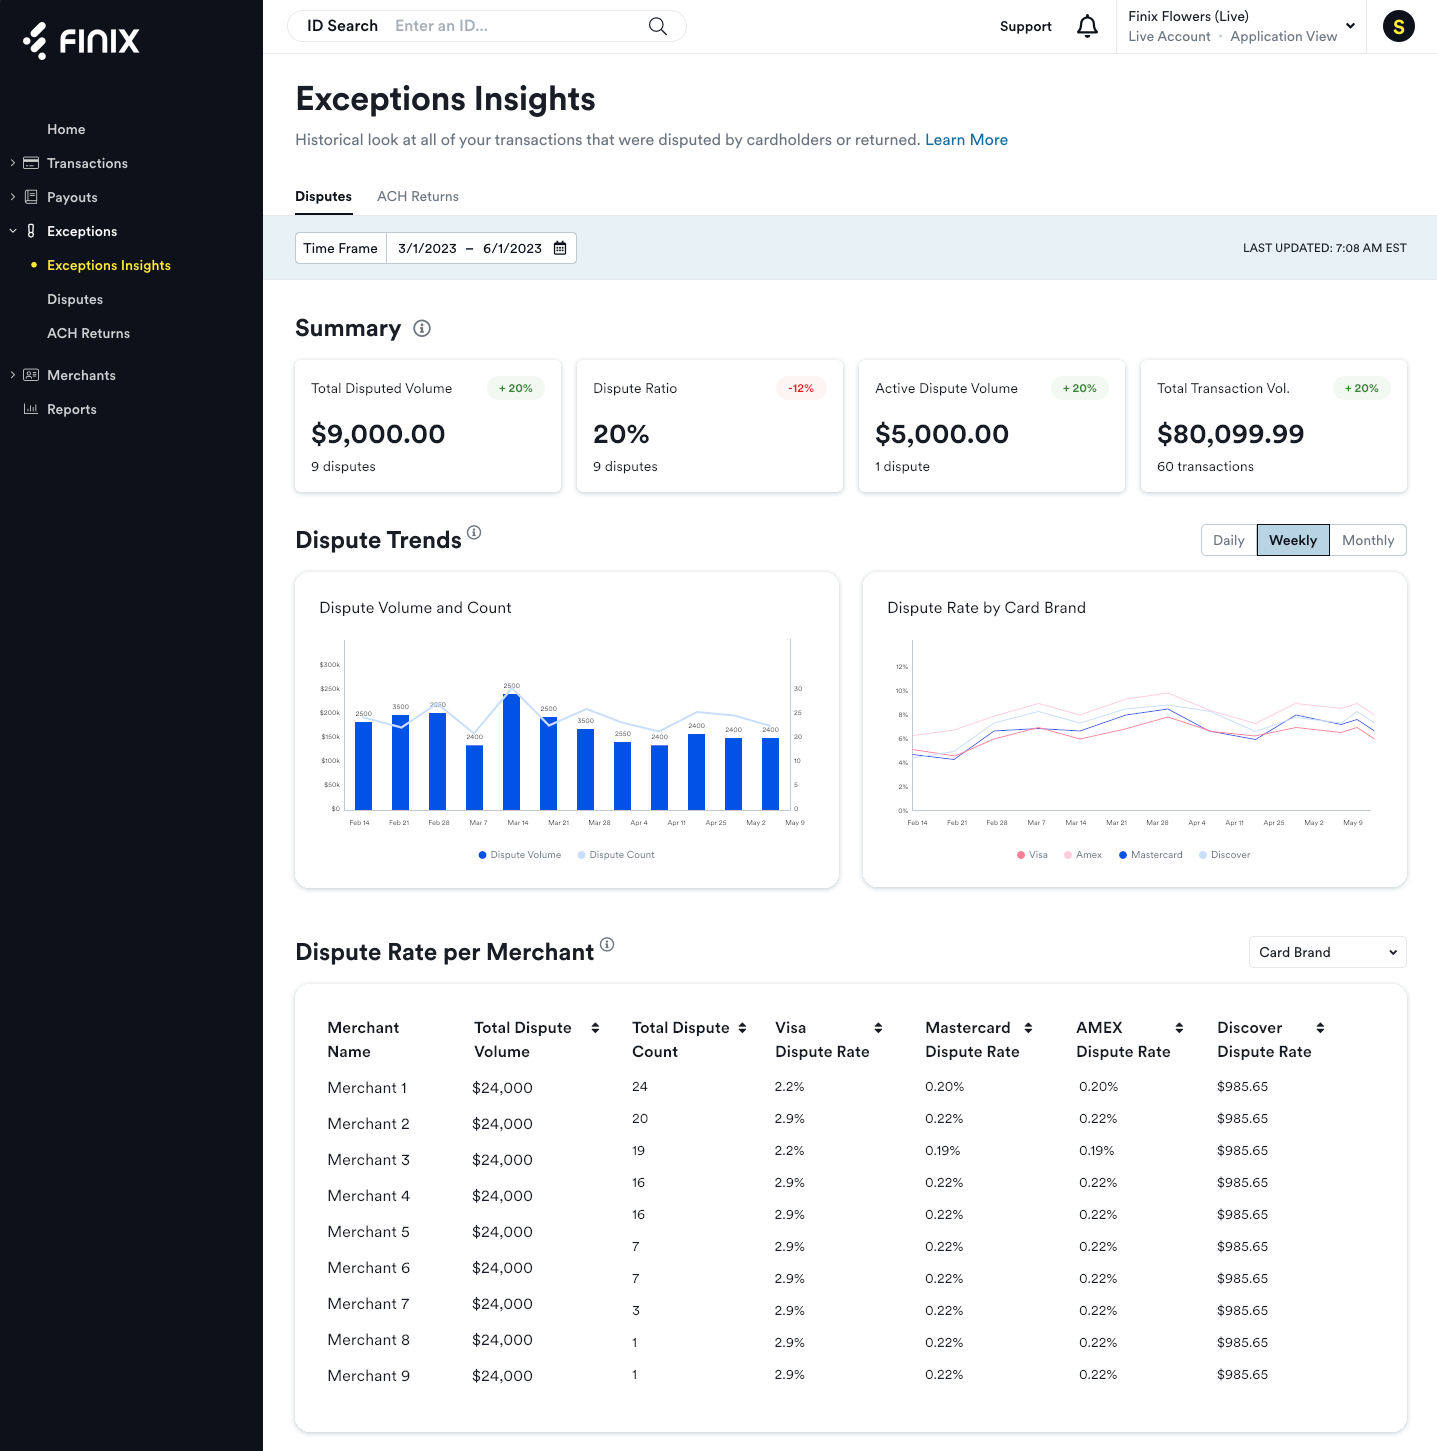
Analytics available on the Exceptions Insights page includes the following:
Disputes
A breakdown of every transaction that was disputed by buyers against Merchants during the filtered timeframe.
For more information, see Disputes.
Summary
A snapshot of the disputes that were created by buyers with their issuing bank.
| Analytic | Description |
|---|---|
| Total Disputed Volume | The total aggregate of funds from disputed transactions. |
| Dispute Ratio | The percentage of card transactions that have had a dispute filed against them. |
| Active Dispute Volume | The total aggregate of funds from disputed transactions where a decision has not been made by the issuing bank. |
| Total Transaction Vol. | The total aggregate of funds from all transactions. |
Dispute Trends
A historical breakdown of the disputes that were created by buyers over the filtered timeframe.
| Analytic | Description |
|---|---|
| Dispute Volume and Count | The number of disputes created and filed by buyers. |
| Dispute Rate by Card Brand | The percentage of card transactions that have had a dispute filed against them, broken down by the card brand used in the original transaction. |
Dispute Rate per Merchant
A breakdown of the disputes filed by buyers, broken down by each Merchant on your application (or platform).
This chart helps you better understand which Merchant is creating transactions that are getting disputed so you can follow up with them and correct any issues they may be having creating transactions.
Card Dispute Data
A breakdown of the disputes filed by buyers, broken down by each card brand used by buyers.
This chart helps you better understand where disputes are originating from. Data available in the table includes:
| Analytic | Description |
|---|---|
| Card Brand | The card brand used in the original transaction. |
| Transaction Volume | The total aggregate of funds from disputed transactions. |
| Dispute Count | The number of disputes created and filed by buyers. |
| Dispute Rate | The percentage of transactions with that card brand that have had a dispute filed against them. |
Dispute Reasons
A breakdown of the disputes filed by buyers, broken down by the reason code used by the issuing bank.
For more information about the different reasons disputes can be created, see Dispute Reasons..
ACH Returns
A breakdown of every ACH Direct Debit transaction that failed and got returned by the buyer's bank.
For more information, see ACH Returns.
Summary
A snapshot of the ACH Direct Debit transactions that failed and got returned by the buyer's bank.
| Analytic | Description |
|---|---|
| Total Disputed Volume | The total aggregate of funds from disputed transactions. |
| Dispute Ratio | The percentage of disputes that were won compared to the number of disputes filed. |
| Active Dispute Volume | The total aggregate of funds from disputed transactions where a decision has not been made by the issuing bank. |
| Card Transaction Vol. | The total aggregate of funds from all payment card transactions. |
| Analytic | Description |
|---|---|
| ACH Return Volume | The total aggregate of funds from returned ACH transactions. |
| ACH Return Count | The total aggregate of ACH transactions that were returned. |
| ACH Return Rate | The percentage of ACH transactions that were returned compared to the number created. |
| Total ACH Volume. | The total aggregate of funds from all ACH transactions. |
ACH Return Trends
A historical breakdown of the ACH Direct Debit transactions that failed and got returned by the buyer's bank.
| Analytic | Description |
|---|---|
| ACH Return Volume and Count | The total aggregate of funds from ACH transactions that were returned. |
| ACH Return Rate | The percentage of ACH transactions that were returned compared to the number created. |
ACH Returns per Merchant
A breakdown of ACH transactions that were returned, broken down by each Merchant on your application (or platform).
This chart helps you better understand which Merchant is creating ACH transactions that are getting returned so you can follow up with them and correct any issues they may be having with ACH transactions.
ACH Returns by Reason Code
A breakdown of the ACH transactions that were returned, broken down by the reason code provided by the recipient bank.
For more information about the different reasons ACH transactions can be returned, see Failed ACH Direct Debits..
Insights Availability
At this time, Insights is available for:
- Finix Flex customers
-
Customers using
FINIX_V1as a processor
If you have any questions about availability or using Insights, please reach out to the Finix Support Team.